Professor Daniel E. Horton, Northwestern Department of Earth & Planetary Sciences
California droughts. The 2014 Polar Vortex in the Midwest and Mid-Atlantic regions. Superstorm Sandy. Weather events are driven by the movement of air in Earth’s atmosphere. Scientists agree that human-caused climate change is warming the planet, but debates on how global warming may be affecting atmospheric circulation continue. Daniel Horton, a climate scientist and assistant professor in the Department of Earth and Planetary Sciences at Northwestern, seeks to answer that question. And his tool-of-choice is Big Data.
“I’m using vast amounts of data to peer into the atmosphere’s behavior, cutting through the ‘noise’ to look for statistical signals of climate change,” Horton said of his research. “I look for climate change signals within patterns of atmospheric circulation.”
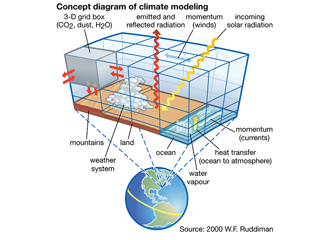
Horton has recently employed two forms of data analysis in his quest to better understand climate change and atmospheric circulation. Prior to his arrival at Northwestern, Horton conducted research using what’s known as “reanalysis data”—daily weather information that assimilates observations in short, three-dimensional model simulations. Such simulations allow researchers to divide Earth, its atmosphere, and often its oceans into three-dimensional grids to more easily study weather patterns.
“Twice a day, scientists all over the world launch weather balloons with sensors, providing information about the atmosphere’s circulation. We also get data from airport weather readings, satellites, ships at sea, and airplanes in flight. All of this data is collected from around the globe and shared, and that’s the kind of information that is incorporated into reanalyses,” Horton explained.
Although insightful, the reanalysis data has its limitations.
“The most reliable of this data only goes back as far as weather satellites—1979,” said Horton. “That means it can be difficult to say if the circulation changes we’ve seen are the result of natural variability or if humans are affecting it. One way to get around this limitation is through climate modeling. That’s the type of analysis I’m working on now.”
I’m using vast amounts of data to peer into the atmosphere’s behavior, cutting through the ‘noise’ to look for statistical signals of climate change. I look for climate change signals within patterns of atmospheric circulation.”
Daniel Horton
Horton’s work at Northwestern is building on the insights he gained in his previous reanalysis studies, but his use of climate models provides a more comprehensive view of the long-term influence that global warming may be having on atmospheric circulation.
“National labs here in the United States and around the world create their own, in-house climate models,” Horton said. “These models simulate the climate system and its components using mathematical relationships based on physical laws. The laws are encoded by national lab teams in millions of lines of computer code. One of the huge advances in the climate community is that each national lab has agreed to run the same experiments using their unique climate models. And then, when they’re done, they share their results freely and we compare them. The cooperation is unprecedented. The amount of data available is enormous, and the power in that shared data is larger still.”
The model that Horton is currently investigating is known as theCommunity Earth System Model (CESM)and is hosted at theNational Center for Atmospheric Research (NCAR). The lines of computer code that set the foundation for the model are rooted in the “primitive equations.” These equations represent the fundamental laws of physics and include: Conservation of Energy, Momentum, and Mass.
For Horton’s research at Northwestern, the CESM is running a suite of experiments—in this case, about 40 different simulations—using the exact same “forcings.” A forcing is any factor that affects Earth’s climate and often includes changes in the energy output of the sun, changes in the atmospheric concentration of greenhouse gases, and volcanic eruptions.
“Each of the 40 simulations uses the same historical and future forcing scenarios,” Horton said. “The only difference in these experiments is the initial conditions we give them. In this case, the models are slightly different in the atmosphere—they begin at a slightly different initial state.”
As computers run the model simulations, climate scientists look at the ways in which seemingly small changes in the models’ initial conditions affect weather and climate over time. When it comes to Earth’s natural systems, small differences can have large and chaotic consequences.
“Running these 40 models with slightly different initial conditions gives us a better sense of the internal variability of the climate system,” said Horton. “These experiments allow us to better understand the range of uncertainty driven by natural variability and inform our climate change projections. Knowing the range of uncertainty about a climate change signal is extremely important for assigning probabilities.”
In addition to providing probabilities associated with climate projections, Horton’s climate model analysis provides insight into how atmospheric circulation fits into the earth’s unfolding and uncertain future.
“Are we seeing a shift to more frequent blocking high pressure systems? Are we seeing systems that last longer? Are the systems more intense? Does the jet stream appear to be speeding up or slowing down? These are the types of signals I’m looking for in the models,” Horton said.
What is atmospheric circulation, and why is it important?
In the Northern Hemisphere mid-latitudes, weather patterns move west-to-east across the earth and are pushed, in large part, by atmospheric circulation driven by wind. Many scientists have hypothesized that climate change may affect the strength and routes of these atmospheric winds, greatly influencing the ways in which weather forms and moves across the planet.
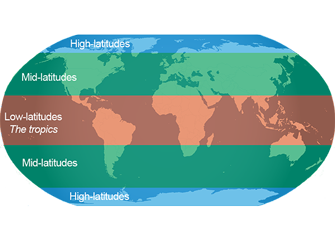
Given that climate change may be affecting atmospheric circulation differently in the arctic and the tropics, scientists are wondering what will happen to the weather in the mid-latitudes.
Horton’s research examines what’s known as the “meridional temperature gradient,” or the rate of change in temperature that occurs between Earth’s equator and the poles.
“We look at the meridional temperature gradient because it directly influences the jet stream, storm tracks, and the patterns and speed with which high- and low-pressure weather systems move around on the planet,” Horton said. “Specifically, I’m looking at how this gradient may be affected by global warming.”
This temperature gradient results from the way the planet is heated by the sun; Earth is generally warmest at the equator where the sunlight is more direct and grows progressively cooler at the poles. The difference in temperature causes differences in air pressure between the regions, which in turn leads to the formation of winds as the atmosphere tries to equalize the air pressure. Thus, the strength of these winds—also known as the jet stream—is directly proportional to the difference in temperature between the equator and the poles.
“One hypothesis says that when the jet stream is strong, it tends to take a straighter path,” Horton said. “But when it's slow and weak, it meanders. And when you have a weather pattern that sits over a region for an extended period of time, bad things can happen.”
Horton pointed to the 1995 Chicago heatwave in which a warm, high-pressure system was sitting over the city for an abnormally long period of time. The extreme heat, coupled with people’s lack of preparation, led to up to 733 premature deaths in the area according toChicago Board of Health reports.
Global warming may be causing some peculiar changes to the meridional temperature gradient, impacting the rates and patterns of atmospheric circulation and movement of weather.
One hypothesis says that when the jet stream is strong, it tends to take a straighter path. But when it's slow and weak, it meanders. And when you have a weather pattern that sits over a region for an extended period of time, bad things can happen.”
Daniel Horton
Simulations allow climate researchers to divide Earth, its atmosphere, and often its oceans into three-dimensional grids to more easily study weather patterns.
“There are two main forces at play, and we’re not quite sure how they’re interacting,” said Horton. “First, there’s what some refer to as ‘arctic amplification.’ This is the idea that, as sea ice and snow cover in the high latitudes [i.e. regions closer to the poles] melt and no longer reflect sunlight away from the planet, the water and surfaces in that area will absorb more heat from the sun. Thisdecreasesthe temperature gradient.”
While global warming is influencing areas near the poles, it may be simultaneously affecting areas closer to the equator in very different ways.
“On the other hand, global temperatures are getting warmer. When air warms, it holds more moisture in the form of water vapor. When this water vapor gets pulled into the upper atmosphere through convection—like it does all the time in the tropics and rainforests—it releases that heat, warming the atmosphere. Thisincreasesthe gradient. These two opposing forces—adecreasinggradient from the arctic and anincreasinggradient from the tropics—have climate scientists wondering what will happen to the weather in the mid-latitudes [e.g. continental United States]. Which one of these forces will dominate, how will they interact, and over what time-scales?” Horton said.
Horton is using Big Data to help solve one of the world’s biggest challenges. But he never loses sight of the fact that his labor is part of a larger, global community: “Is there another scientific field you can think of in which data is shared so freely? It’s a huge international collaborative effort, which speaks to the level of concern within the scientific community. The view seems to be that data is freely shared because itneedsto be.”
New research from Northwestern University tracks the year-over-year regularity of rainfall levels across the US, an issue altering the outlook for agriculture and water resource management as well as impacting the wellbeing of ecosystems and wildlife